
Abstract
Aim
To compare inflammatory indices derived from blood counts between influenza positive and negative children evaluated in the emergency department and examine the association of pan-immune-inflammation value (PIV) with influenza positivity.
Materials and Methods
This retrospective study included 903 children with upper respiratory tract symptoms who underwent blood counts, C-reactive protein (CRP) measurement, and influenza polymerase chain reaction testing at the same emergency visit. Group comparisons and receiver operating characteristic analyses were conducted using the full sample. An exploratory regression within overlapping ages (n=783) was performed, adjusting for age and CRP, using restricted cubic splines.
Results
Influenza was positive in 366 children (40.5%). The systemic immune-inflammation index (SII), the systemic inflammation response index (SIRI), and the PIV were lower in positive children (all p<0.001). Areas under the curve were 0.575, 0.619, and 0.648, respectively, with lower values indicating positivity. Across overlapping age groups, the adjusted odds ratio per PIV doubling was 0.746 (95% confidence interval, 0.672-0.828). Bootstrap-corrected model discrimination increased from 0.700 to 0.731 after adding PIV.
Conclusion
Lower composite indices were associated with influenza positivity in this selected sample. Limited discrimination and sampling constraints preclude claims of validated clinical diagnostic utility.
Keywords: Influenza, children, emergency department, blood cell count, inflammatory indices
Introduction
Influenza remains an important cause of childhood respiratory illness and may lead to serious complications (,). Its symptoms overlap with those of other respiratory infections; therefore, virologic testing, including polymerase chain reaction (PCR), remains central to establishing influenza status (). Complete blood count (CBC) findings may describe the accompanying cellular pattern, but an association with infection does not establish that a marker improves diagnosis or patient care.
Previous pediatric studies have assessed leukocyte and platelet counts and ratios, such as the neutrophil-to-lymphocyte ratio (NLR) and the lymphocyte-to-monocyte ratio, with their performance varying by age, comparator population, and reference test (-). Hematologic markers have also been examined in predominantly adult respiratory infection cohorts (). The systemic immune-inflammation index (SII), systemic inflammation response index (SIRI), and pan-immune-inflammation value (PIV) are based on several cell populations. Evidence from pneumonia requiring intensive care, comparisons of influenza and Coronavirus disease-2019 (COVID-19) pneumonia, and pediatric infections shows that the clinical setting and outcome must be considered when interpreting such measures (-).
A recent pediatric influenza study evaluated an aggregate index of systemic inflammation, using the same cell-count formula as PIV, to predict pulmonary complications among hospitalized children (). That prognostic question differs from a comparison of influenza-positive and influenza-negative children presenting with upper respiratory tract symptoms. In a selected emergency department (ED) cohort, we examined differences in SII, SIRI, and PIV by influenza PCR status, their correlations with C-reactive protein (CRP), and the association of PIV with influenza positivity after adjustment for age and CRP. The analyses were exploratory; no index or diagnostic threshold was prospectively prespecified as a primary endpoint.
Materials and Methods
Study Design and Population
This retrospective observational study included children aged <18 years who were evaluated for upper respiratory tract symptoms in the ED of a secondary care hospital between January 1, 2023, and January 1, 2025. Demographic, laboratory, influenza test, and medical history data were extracted from the ED hospital information management system. The study was approved by the Başkent University Institutional Review Board (protocol no: KA25/476, date: 13.01.2026), which waived the requirement for informed consent because of its retrospective, anonymized design. Reporting followed the STROBE framework ().
Patient Selection
Upper respiratory tract symptoms were the clinical indications for testing. Eligibility required CBC, CRP, and influenza results obtained at the same ED encounter, as well as sufficient medical history to assess exclusion criteria. For children who attended more than once, the first eligible visit with the required tests was retained, and subsequent visits were excluded from the analysis. The screened denominator, 1,208, represents unique children after removal of repeat encounters, rather than all ED visits or all children with respiratory symptoms.
Children with a malignancy, those receiving immunosuppressive treatment, those with an autoimmune disease, or those missing CBC, CRP, or influenza results, or those with inadequate medical history were excluded. A positive throat or urine culture and/or a procalcitonin (PCT) level >0.05 ng/mL within one week of the index visit constituted an additional operational exclusion criterion. Cultures and PCT were performed only in selected patients. A positive culture led to exclusion even when contamination was suspected. This rule was not equivalent to confirmation of bacterial coinfection for every excluded child, and bacterial coinfection was not systematically assessed throughout the cohort.
Virologic Testing and Laboratory Variables
Nasal swab specimens were used for PCR testing targeting influenza A and influenza B. Children positive for either target were included in the influenza-positive group; dual A+B positivity was counted once. The comparator group had negative influenza A/B results. Alternative etiologic diagnoses and other pathogen test results were not available in the analyzed dataset; therefore, a negative influenza result was not considered evidence of a specific alternative infection. CBC, CRP, and influenza samples were collected during the same ED encounter; symptom duration and precise temporal order were not available in the analyzed dataset.
Absolute leukocyte, neutrophil, lymphocyte, monocyte, and platelet counts were expressed in 103/µL; hemoglobin in g/dL; red cell distribution width (RDW) in percent; and CRP in mg/L. Indices were recalculated as follows: NLR=neutrophils/lymphocytes; MLR=monocytes/lymphocytes; PLR=platelets/lymphocytes; Hb/RDW=hemoglobin/RDW; SII=platelets×neutrophils/lymphocytes; SIRI=neutrophils×monocytes/lymphocytes; and PIV=platelets×neutrophils×monocytes/lymphocytes. The composite indices were computed using the stated numerical cell-count units; they should not all be regarded as dimensionless.
Statistical Analysis
Data and statistical results were checked using IBM SPSS statistics version 27.0 (IBM Corp., Armonk, NY, USA). Statistical analyses were performed in Python 3.12.14 using NumPy 2.3.5, pandas 2.2.3, SciPy 1.17.0, and scikit-learn 1.8.0. Results from SPSS were consistent with the corresponding Python outputs for the analyses checked. Influenza positivity was coded as 1 and negativity as 0. Shapiro-Wilk tests were used to assess the distributions of continuous variables. Non-normally distributed variables were summarized by median, 25th and 75th percentiles, and range. Quartiles were calculated using linear interpolation. Two-sided Mann-Whitney U tests were used to compare continuous distributions, and Pearson’s chi-square test was used to compare sex. Raw p values were reported, with an additional Holm adjustment applied across the seven index comparisons. Spearman’s correlations were used to assess the associations of SII, SIRI, and PIV with CRP. Variables for analysis were complete in the final sample; no imputation was performed.
Single-index receiver operating characteristic (ROC) analysis included all 903 children; lower index values indicated influenza positivity. Areas under the curve (AUCs) and 95% confidence intervals (CIs) were calculated using the non-parametric DeLong variance (). Youden index thresholds and their apparent operating characteristics were calculated in the same sample as exploratory estimates and were not considered validated clinical decision thresholds.
The full-cohort logistic model was assessed for logit linearity using Box-Tidwell-type interaction terms and for calibration using a decile Hosmer-Lemeshow test. Concerns regarding logit linearity and calibration, together with limited age overlap between the groups, prompted additional exploratory analyses. Descriptive comparisons and single-index ROC analyses included all 903 children. Adjusted analyses were restricted post hoc to the observed common age interval of 2.25-9.9167 years, comprising 783 children. This restriction limits extrapolation; it does not eliminate selection bias or establish applicability to older children.
Age and log2(CRP) were modeled with restricted cubic splines using four knots at the empirical 5th, 35th, 65th, and 95th percentiles (). PIV was log2-transformed, so its odds ratio (OR) represents the change associated with a doubling. Age and CRP were retained for clinical relevance. PIV was chosen during exploratory analysis as a representative composite measure incorporating neutrophils, monocytes, platelets, and lymphocytes; this selection was informed by the observed results. Mathematically overlapping composite indices were not entered simultaneously. Univariable significance screening, stepwise elimination, and penalized variable selection were not used. Global likelihood-ratio tests assessed the adjusted and unadjusted terms. The spline effects of age and CRP were not summarized by a single, constant OR.
The age-and-CRP model was compared with the model adding PIV using a likelihood-ratio test; the change in AUC was reported descriptively. In-sample DeLong significance tests were not used for these nested fitted models (). Internal validation used 500 bootstrap resamples (seed 20261014), re-estimating knots and refitting the specified models in each resample. Optimism-corrected AUC, Brier score, calibration slope, and intercept were estimated (). This validation was conditional on the specified model structure and did not account for the selection of PIV from among the candidate indices.
Additional non-linear PIV terms, sex adjustment, restriction to age <10 years, exclusion of the upper 1% of PIV values, and exclusion of dual A+B positive records were examined. Term-level generalized variance inflation factors (GVIFs), leverage, approximate Cook’s distance, and Pearson residuals were inspected. GVIF >5 was used as a descriptive flag for potential collinearity, alongside term degrees of freedom and
GVIF(1/[2×df]); it was not used as an automatic exclusion criterion. No observations were removed from the main analyses on the grounds of statistical influence. A separate, unpenalized logistic regression solver evaluated the fitted probabilities. Tests were two-sided, with nominal p<0.05. Model and sensitivity analyses were exploratory.
Results
Participant Selection and Baseline Characteristics
Of the 1,208 unique children assessed, 305 were excluded: 51 for the culture/PCT rule, 3 for malignancy, 8 for immunosuppressive treatment, and 243 for missing required laboratory results or an adequate medical history. Each excluded child was assigned to one exclusion group; none were excluded because of autoimmune disease. Among the 51 who met the culture/PCT rule, 39 had PCT >0.05 ng/mL, 37 had positive cultures, and 25 had both. Thus, 14 met only the PCT criterion and 12 only the culture criterion; these categories do not establish that the other test was performed and found to be negative. The final sample comprised 903 children ().
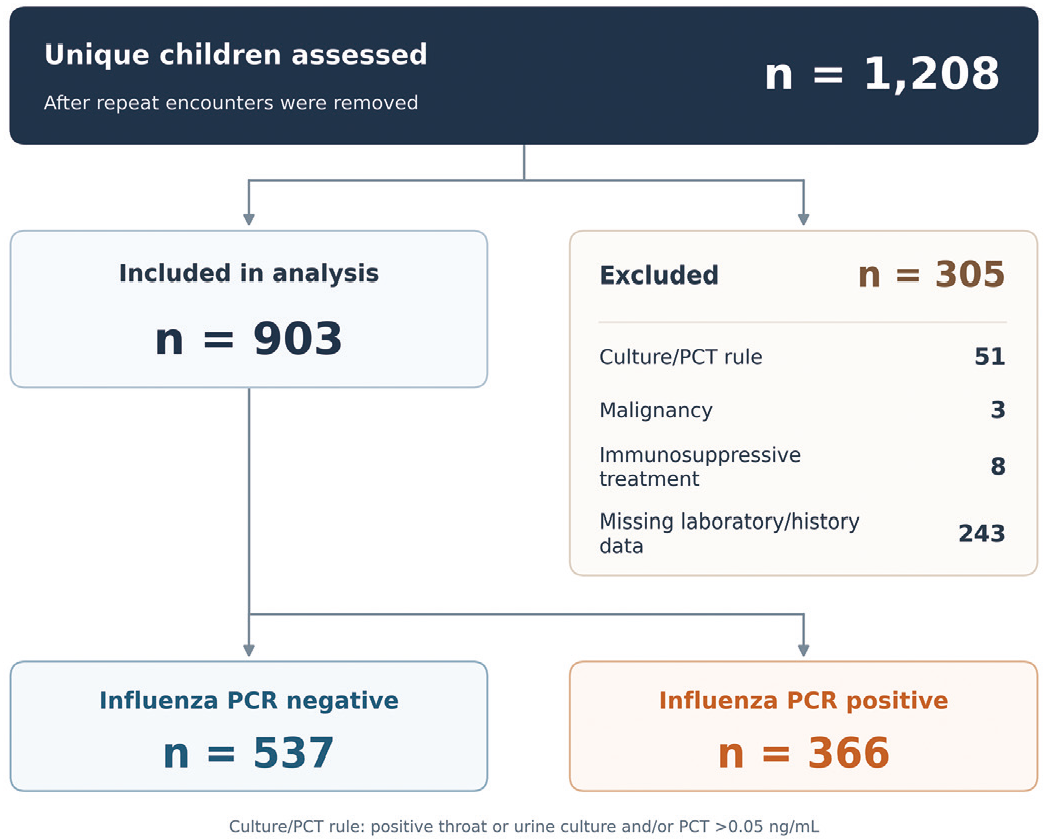
Participant selection. The denominator represents 1,208 unique children after removal of repeat encounters; the first eligible visit with the required tests was retained. Each excluded child was counted in one group. Missing data comprised absent complete blood count, C-reactive protein, influenza results, or adequate medical history. The 51 culture/PCT exclusions were 14 meeting only the PCT criterion, 12 meeting only the culture criterion, and 25 meeting both; “only” does not imply that the other test was performed and negative
PCT: Procalcitonin, PCR: Polymerase chain reaction
Influenza was positive in 366 children (40.5%) and negative in 537 children (59.5%). Among positive children, 241 had influenza A alone, 118 had influenza B alone, and 7 had dual A+B positivity. Positive children were older, whereas the proportions of female children were similar (48.9% vs. 49.0%). Leukocyte, neutrophil, lymphocyte, monocyte, platelet, and CRP values were lower, and hemoglobin was higher in positive children (all p<0.001); RDW did not differ significantly ().
Table 1. Baseline characteristics by influenza PCR status
Variable | Negative (n=537) | Positive (n=366) | p |
|---|---|---|---|
Age (years) | 6.08 (4.08-8.00) [2.25-9.92] | 7.50 (5.27-10.48) [1.00-17.92] | <0.001 |
Female sex, n (%) | 263 (49.0) | 179 (48.9) | 0.984 |
Leukocytes (103/µL) | 10.20 (7.64-13.80) [3.09-33.70] | 6.03 (4.73-8.44) [2.08-23.50] | <0.001 |
Neutrophils (103/µL) | 6.15 (3.87-9.25) [0.42-25.50] | 3.15 (2.42-5.37) [0.28-19.10] | <0.001 |
Lymphocytes (103/µL) | 2.51 (1.61-3.77) [0.31-17.20] | 1.42 (1.08-2.28) [0.33-8.89] | <0.001 |
Monocytes (103/µL) | 1.00 (0.72-1.41) [0.09-3.80] | 0.67 (0.56-0.92) [0.07-2.97] | <0.001 |
Platelets (103/µL) | 275.0 (226.0-335.0) [107.0-756.0] | 230.0 (198.3-273.8) [19.5-595.0] | <0.001 |
Hemoglobin (g/dL) | 12.7 (12.0-13.4) [8.5-19.1] | 13.1 (12.5-13.7) [6.9-22.1] | <0.001 |
RDW (%) | 12.5 (11.7-13.4) [9.3-20.3] | 12.4 (11.7-13.3) [9.3-21.4] | 0.493 |
CRP (mg/L) | 12.1 (1.8-42.6) [0.5-301.6] | 4.0 (1.1-11.6) [0.5-140.6] | <0.001 |
Continuous data are median (25th-75th percentiles), with [minimum-maximum]. Quartiles use linear interpolation. Mann-Whitney U tests compare distributions; sex uses Pearson’s chi-square test. All p values are unadjusted. PCR: Polymerase chain reaction, CRP: C-reactive protein, RDW: Red cell distribution width
Children who tested negative ranged in age from 2.25 to 9.9167 years, whereas children who tested positive ranged in age from 1.00 to 17.9167 years. All 537 negative children were <10 years old. In the positive group, 256 (69.9%) were <10 years old, 88 (24.0%) were 10-<15 years old, and 22 (6.0%) were 15-<18 years old. The common age interval contained 783 children, including 246 positive and 537 negative; the 120 positive children outside this interval remained in the full descriptive sample.
Inflammatory Indices and Discrimination
SII, SIRI, and PIV were lower in positive children; the median values were 500.8 vs. 723.6 for SII, 1.44 vs. 2.73 for SIRI, and 336.3 vs. 765.4 for PIV, respectively (all raw p<0.001; , ). MLR, PLR, and Hb/RDW were higher, while NLR did not differ significantly. All index comparisons except NLR remained significant after Holm adjustment. CRP correlated positively with SII (rho=0.320), SIRI (rho=0.402), and PIV (rho=0.390; all p<0.001).
Table 2. Blood count derived indices by influenza PCR status
Index | Negative (n=537) | Positive (n=366) | Raw p | Holm p |
|---|---|---|---|---|
NLR | 2.55 (1.32-4.74) [0.09-28.94] | 2.02 (1.40-3.87) [0.10-21.45] | 0.135 | 0.135 |
SII | 723.6 (339.6-1387.5) [15.8-7496.5] | 500.8 (306.2-943.4) [3.0-6253.1] | <0.001 | <0.001 |
SIRI | 2.73 (1.21-5.16) [0.05-43.89] | 1.44 (1.00-3.10) [0.02-19.02] | <0.001 | <0.001 |
PIV | 765.4 (302.8-1483.6) [8.6-14703.4] | 336.3 (195.4-742.3) [3.6-5990.5] | <0.001 | <0.001 |
MLR | 0.43 (0.28-0.65) [0.02-3.50] | 0.48 (0.31-0.65) [0.03-2.04] | 0.023 | 0.045 |
PLR | 115.1 (77.1-174.2) [20.1-990.3] | 174.2 (102.0-213.0) [9.1-717.6] | <0.001 | <0.001 |
Hb/RDW | 1.02 (0.91-1.12) [0.48-1.53] | 1.05 (0.98-1.13) [0.32-1.59] | 0.001 | 0.003 |
Data are median (25th-75th percentiles), with [minimum-maximum]. Quartiles use linear interpolation. Two-sided Mann-Whitney U tests compare distributions. Holm adjustment covers all seven index comparisons. Composite values use numerical counts in 103/µL; hemoglobin is in g/dL and RDW in percent. PCR: Polymerase chain reaction, NLR: Neutrophil-to-lymphocyte ratio, MLR: Monocyte-to-lymphocyte ratio, PLR: Platelet-to-lymphocyte ratio, SII: Systemic immune-inflammation index, SIRI: Systemic inflammation response index, PIV: Pan-immune-inflammation value, Hb/RDW: Hemoglobin divided by red cell distribution width
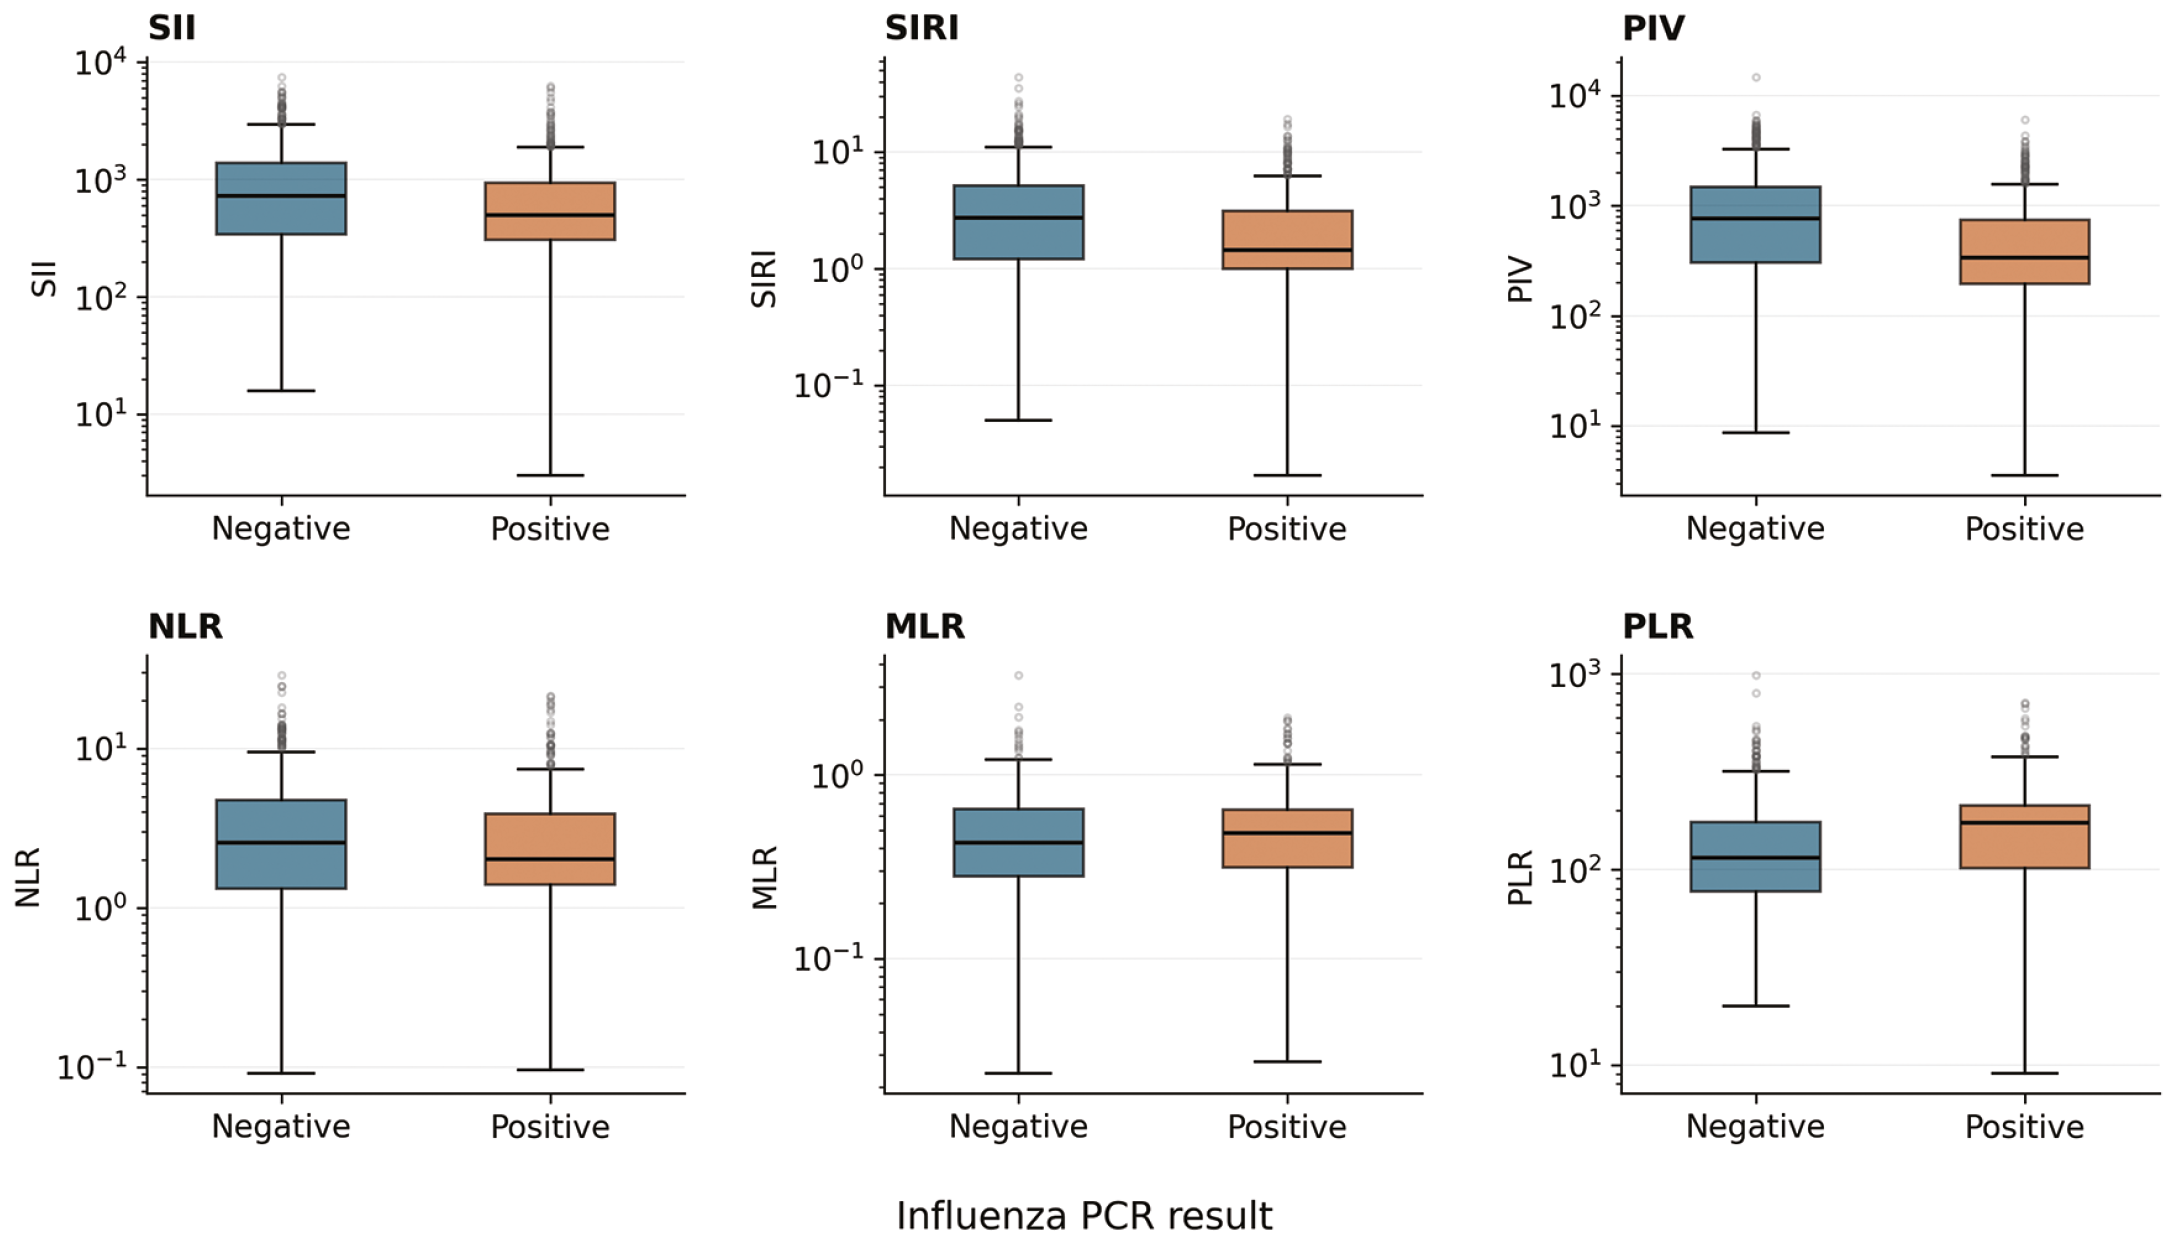
Distributions of blood count derived indices by influenza PCR status. The six panels show SII, SIRI, PIV, NLR, MLR, and PLR for all 903 children. Boxes delimit the 25th and 75th percentiles and horizontal lines show medians. Whiskers reach the most extreme observations within 1.5 times the interquartile range on the original scale; other observations are plotted individually. Vertical axes are logarithmic. Blue denotes influenza negative and orange influenza positive children
SII: Systemic immune-inflammation index, SIRI: Systemic inflammation response index, PIV: Pan-immune-inflammation value, NLR: Neutrophil-to-lymphocyte ratio, MLR: Monocyte-to-lymphocyte ratio, PLR: Platelet-to-lymphocyte ratio, PCR: Polymerase chain reaction
With lower values indicating positivity, full-cohort AUCs were 0.575 (95% CI 0.537-0.612) for SII, 0.619 (0.582-0.656) for SIRI, and 0.648 (0.612-0.684) for PIV (). These indicated limited discrimination, despite statistical evidence of AUCs above 0.5. For the exploratory PIV threshold ≤413.732, apparent sensitivity was 60.9% and specificity 67.8%. Threshold- and common-age ROC results are presented in , .
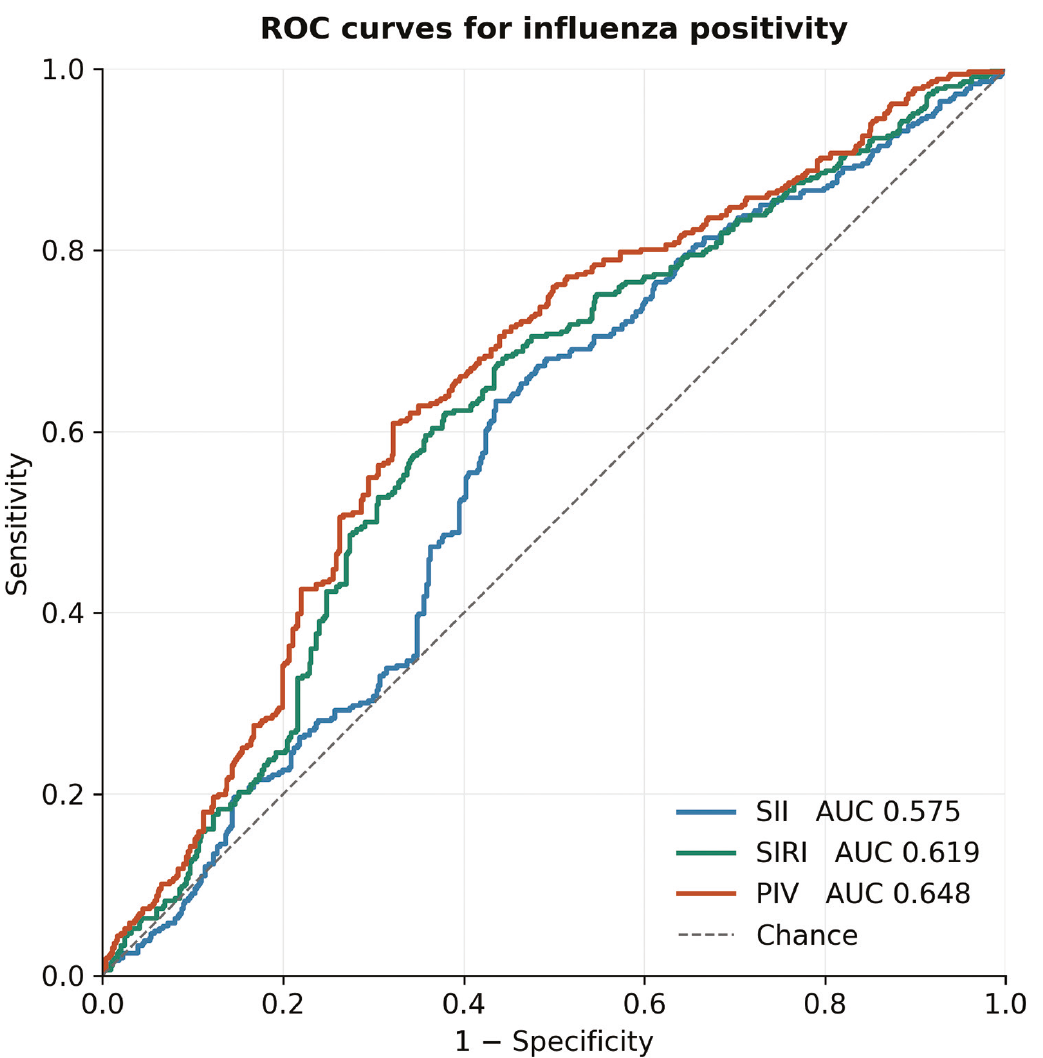
ROC curves for influenza positivity. All 903 children, including 366 positive children, are included. Lower index values indicate influenza positivity. Areas under the curve are 0.575 for SII, 0.619 for SIRI, and 0.648 for PIV. The dashed diagonal represents chance discrimination
ROC: Receiver operating characteristic, SII: Systemic immune-inflammation index, SIRI: Systemic inflammation response index, PIV: Pan-immune-inflammation value
Exploratory Adjusted Analyses
In the full-cohort logistic regression model with linear terms for age, CRP, and PIV, the joint Box-Tidwell-type test indicated non-linearity (p<0.001), and the decile Hosmer-Lemeshow test yielded p=0.002. In the sample of 783 children within the common age interval, spline analyses showed non-linear associations for age and CRP (p=0.009 and p<0.001, respectively). In this sample, the unadjusted PIV OR per doubling was 0.726 (95% CI 0.663-0.796), and the adjusted OR was 0.746 (95% CI 0.672-0.828; ). The adjusted likelihood-ratio p value for PIV was <0.001. Additional non-linear PIV terms yielded p=0.105, which does not establish that its logit relationship is exactly linear.
Table 3. Exploratory regression within common ages
Predictor | df | Unadjusted OR (95% CI) | Global p | Adjusted OR (95% CI) | Global p |
Age, spline | 3 | — | 0.005 | — | <0.001 |
CRP, log2 spline | 3 | — | <0.001 | — | <0.001 |
PIV, per doubling | 1 | 0.726 (0.663-0.796) | <0.001 | 0.746 (0.672-0.828) | <0.001 |
The post hoc sample contains 783 children aged 2.25-9.9167 years (537 negative, 246 positive). Adjusted analysis includes age, CRP, and PIV. Age and log2(CRP) use four-knot restricted cubic splines; neither has a single constant OR, indicated by —. PIV is log2-transformed, and the OR describes a doubling. OR confidence intervals use Wald variance; global p values use likelihood-ratio tests. The PIV Wald p value is also <0.001. Spline knots and coefficients are provided in the supplementary model specification. OR: Odds ratio, CI: Confidence interval, df: Degrees of freedom, CRP: C-reactive protein, PIV: Pan-immune-inflammation value
Adding PIV improved the model fit (likelihood-ratio χ2=32.39, 1 degree of freedom, p<0.001). The apparent AUC increased from 0.708 to 0.740, and the optimism-corrected AUCs were 0.700 and 0.731. Corrected Brier scores were 0.194 and 0.185, and corrected calibration slopes were 0.949 and 0.953, respectively (). All 500 resamples converged. The bootstrap percentile CI for the PIV OR was 0.669-0.822. These estimates quantify internal sample performance but do not indicate validated clinical benefit.
Table 4. Model performance within common ages
Measure | Age + CRP | Age + CRP + PIV |
|---|---|---|
Parameters including intercept | 7 | 8 |
AIC | 897.05 | 866.66 |
BIC | 929.69 | 903.96 |
Apparent AUC | 0.708 | 0.740 |
Apparent Brier score | 0.191 | 0.182 |
Corrected AUC | 0.700 | 0.731 |
Corrected Brier score | 0.194 | 0.185 |
Corrected calibration slope | 0.949 | 0.953 |
Corrected calibration intercept | -0.033 | -0.031 |
n=783 (537 negative, 246 positive), aged 2.25-9.9167 years. Models use the same age and log2(CRP) splines; the second adds log2(PIV). Corrected values are optimism-corrected estimates from 500 successful bootstrap resamples, re-estimating knots and refitting each model. Lower Brier scores indicate lower mean squared probability error. Ideal calibration slope and intercept are 1 and 0. Adding PIV: likelihood-ratio χ2=32.39, df=1, p<0.001; apparent ΔAUC=0.032 and corrected ΔAUC=0.031. AIC and BIC are descriptive, not used for stepwise selection. Validation is conditional on the selected model and does not account for index selection. AUC: Area under the receiver operating characteristic curve, AIC: Akaike information criterion, BIC: Bayesian information criterion, CRP: C-reactive protein, PIV: Pan-immune-inflammation value, df: Degrees of freedom
Term-level GVIFs were 1.132 for age, 1.174 for log2(CRP), and 1.176 for log2(PIV). Maximum leverage was 0.042 and maximum approximate Cook’s distance was 0.018; 34 observations exceeded the descriptive Cook’s threshold 4/n, and 8 had absolute Pearson’s residuals >3. All observations were retained. PIV estimates were similar after adjustment for sex and in the specified sensitivity samples (, ). Fitted probabilities differed by <0.000001 between the two logistic regression solvers.
Discussion
In this selected ED sample, influenza-positive children had lower SII, SIRI, and PIV than influenza-negative children. The PIV association persisted in an exploratory analysis restricted to common ages, after flexible adjustment for age and CRP. Single-index AUCs were modest, and the internally evaluated gain after adding PIV does not demonstrate improved treatment decisions or outcomes. The contribution provides a comparative description of several composite indices and their components, with an explicit assessment of age overlap and model assumptions, rather than introducing a new index or a validated diagnostic test.
Our lower leukocyte and platelet values are compatible with the pediatric findings of de Silva et al. (), whose PCR-referenced cohort reported a leukocyte AUC of 0.71. Zhu et al. () evaluated age-specific blood count markers against symptomatic influenza-negative and healthy comparators, while Hong et al. () studied age-stratified CBC findings using an influenza A antigen reference test. Their populations, markers, and reference standards differ from ours, so diagnostic performance cannot be compared directly. These studies also reinforce that a negative respiratory comparator should not be treated as a healthy control.
The composite results should be interpreted based on their arithmetic values. SII equals platelets×NLR, SIRI equals monocytes×NLR, and PIV equals platelets×monocytes×NLR. Lower platelet and monocyte distributions can therefore accompany lower composite indices, even when NLR itself does not separate the groups. In our data, lymphocyte counts were also lower, and MLR and PLR were higher in positive children, illustrating that the overall cellular pattern cannot be reduced to uniformly lower inflammation. Group medians do not establish which component caused an individual index value, and these cross-sectional data cannot demonstrate a specific immunologic mechanism.
Influenza-related hematologic studies address different clinical questions. Han et al. () and Qi et al. () evaluated diagnostic differentiation in populations containing adult patients and different comparator groups, while Kazancioglu et al. () and Yeşildağ and Kocabas () compared influenza with COVID-19. Ng et al. () studied pneumonia in intensive care, and Topaz et al. () examined RDW and hospital outcomes in influenza. Comparisons of pediatric SII and SIRI have also been reported for respiratory syncytial virus and Mycoplasma pneumoniae pneumonia (). Their results do not provide a universal threshold for children with upper respiratory tract symptoms.
Wu et al. () studied pulmonary complications among hospitalized influenza-positive children, using an aggregate index with the same neutrophil×monocyte×platelet/lymphocyte formula as PIV. That outcome differs from the influenza status among symptomatic ED attendees. Accordingly, a lower PIV in our positive group does not contradict an association between PIV and disease severity among infected patients, nor does it indicate that lower values correspond to milder disease. We did not measure disease severity or clinical outcomes.
The observed age imbalance materially affects the interpretation. No negative child was ≥10 years old; a full-cohort age coefficient would therefore extrapolate the comparator relationship to older positive children. Restricting adjusted analysis to common ages and allowing non-linear age and CRP effects provide a more bounded comparison. It cannot establish the association throughout childhood. PIV was selected during exploratory analysis, and conditional bootstrap validation does not remove the optimism associated with that selection. An improvement of approximately 0.03 in corrected AUC requires independent evaluation before any incremental diagnostic role can be asserted.
The exclusion procedure also shaped the comparison. PCT and cultures were obtained selectively, and the PCT threshold and positive-culture rule were operational criteria rather than constituting a comprehensive adjudication of bacterial infection. Influenza guidance emphasizes that PCT results require clinical interpretation and have limited specificity for bacterial coinfection (). Exclusion of positive cultures, despite possible contamination, could remove children without true bacterial infections. Because the dataset contains data on only the included children rather than complete test denominators and clinical details for all screened patients, the direction and extent of this selection effect cannot be quantified.
Study Limitations
The retrospective single-center design and the requirement for CBC, CRP, influenza test results, and an adequate history limit generalizability. The exclusion of 243 children with incomplete laboratory or history data may also have introduced selection bias. Influenza-negative children had an unidentified mixture of etiologies in the analyzed dataset; results for other pathogens and alternative diagnoses were unavailable for characterization. Selective PCT/culture testing did not systematically exclude bacterial coinfection. The positive-culture or PCT >0.05 ng/mL exclusion rule could also have excluded children without true bacterial infection. The absence of negative children aged ≥10 years restricts adjusted inference to common ages. Index selection, sample-derived thresholds, model specifications, and sensitivity analyses were exploratory; internal validation was conditional on the chosen model, and no external validation was performed. Laboratory values were obtained from a single ED encounter; the analyzed dataset contained no serial measurements, precise sampling intervals, or symptom-duration information. Details of the assay platform and analyzer were not reported, limiting technical reproducibility. Treatment decisions, clinical severity, and patient outcomes were not evaluated.
Conclusion
Among children with upper respiratory tract symptoms in this selected ED cohort, influenza positivity was associated with lower SII, SIRI, and PIV, whereas NLR did not differ significantly between groups. These composite-index differences should be interpreted in the context of lower platelet and monocyte counts. Within overlapping age ranges, PIV remained inversely associated with positivity after flexible adjustment for age and CRP, and adding PIV improved the internally assessed model performance. However, the limited discriminatory power of individual indices and the sampling constraints preclude claims of validated clinical diagnostic utility. Prospective studies with clinically characterized comparator groups, broader age overlap, and external validation are needed to determine whether these indices add useful information to routine clinical assessment.
Ethics
Ethics Committee Approval: The study was approved by the Başkent University institutional review board (protocol no: KA25/476, date: 13.01.2026).
Informed Consent: The requirement for informed consent was waived by the Institutional Review Board due to the retrospective and anonymized nature of the study.
Footnotes
Authorship Contributions
Surgical and Medical Practices: M.K., K.U.K., S.A.K., O.Ö., Concept: M.K., Design: M.K., Data Collection or Processing: M.K., K.U.K., S.A.K., O.Ö., Analysis or Interpretation: M.K., Literature Search: M.K., Writing: M.K.
Conflict of Interest
No conflict of interest was declared by the authors.
Financial Disclosure
The study was supported by the Başkent University Research Fund (project no: KA25/476).
References
World Health Organization. Global influenza strategy 2019-2030. Geneva: World Health Organization; 2019. Available from: https://www.who.int/publications/i/item/9789241515320
Shang M, Blanton L, Brammer L, Olsen SJ, Fry AM. Influenza-associated pediatric deaths in the United States, 2010-2016. Pediatrics. 2018;141:e20172918.
Uyeki TM, Bernstein HH, Bradley JS, Englund JA, File TM, Fry AM, et al. Clinical Practice Guidelines by the Infectious Diseases Society of America: 2018 update on diagnosis, treatment, chemoprophylaxis, and institutional outbreak management of seasonal influenza. Clin Infect Dis. 2019;68:895-902.
Zhu R, Chen C, Wang Q, Zhang X, Lu C, Sun Y. Routine blood parameters are helpful for early identification of influenza infection in children. BMC Infect Dis. 2020;20:864.
Hong J, Lv J, Wu M, Shao J, Wu Q. The blood routine test holds screening values for influenza A in 2023: a retrospective study. Transl Pediatr. 2024;13:236-47.
de Silva MHAD, Ekanayake N, Darshana N. Validity of complete blood count in detecting influenza among clinically suspected children in Sri Lanka: a retrospective study from low resource setting country. BMC Infect Dis. 2026;26:816.
Han Q, Wen X, Wang L, Han X, Shen Y, Cao J, et al. Role of hematological parameters in the diagnosis of influenza virus infection in patients with respiratory tract infection symptoms. J Clin Lab Anal. 2020;34:e23191.
Ng WWS, Lam SM, Yan WW, Shum HP. NLR, MLR, PLR and RDW to predict outcome and differentiate between viral and bacterial pneumonia in the intensive care unit. Sci Rep. 2022;12:15974.
Yeşildağ M, Kocabas R. Influenza A (H1N1) and COVID-19 pneumonias: an evaluation in the light of new hematologic indices. J Inflamm Res. 2025;18:13103-16.
Zhou HH, Qian KL. Comparison of the systemic inflammatory response index and the systemic immune-inflammatory index in pediatric community-acquired pneumonia caused by respiratory syncytial virus and Mycoplasma pneumoniae. Front Pediatr. 2025;13:1694856.
Wu Y, Zhang J, Ke X, Pan J, Hu Y. Predictive value of the prognostic nutritional index and aggregate index of systemic inflammation for pulmonary complications in children with influenza. Transl Pediatr. 2026;15:343.
Vandenbroucke JP, von Elm E, Altman DG, Gøtzsche PC, Mulrow CD, Pocock SJ, et al. Strengthening the reporting of observational studies in epidemiology (STROBE): explanation and elaboration. PLoS Med. 2007;4:e297.
DeLong ER, DeLong DM, Clarke-Pearson DL. Comparing the areas under two or more correlated receiver operating characteristic curves: a nonparametric approach. Biometrics. 1988;44:837-45.
Schuster NA, Rijnhart JJM, Twisk JWR, Heymans MW. Modeling non-linear relationships in epidemiological data: the application and interpretation of spline models. Front Epidemiol. 2022;2:975380.
Demler OV, Pencina MJ, D’Agostino RB Sr. Misuse of DeLong test to compare AUCs for nested models. Stat Med. 2012;31:2577-87.
Collins GS, Reitsma JB, Altman DG, Moons KGM. Transparent reporting of a multivariable prediction model for individual prognosis or diagnosis (TRIPOD): the TRIPOD statement. BMJ. 2015;350:g7594.
Qi JF, Guo ML, Lin L, Fu S, Chen LL. An exploration of the value of NLR, PLR, LMR, and WBC × CRP for the diagnosis and treatment of influenza B in adults. Medicine (Baltimore). 2024;103:e37046.
Kazancioglu S, Bastug A, Ozbay BO, Kemirtlek N, Bodur H. The role of haematological parameters in patients with COVID-19 and influenza virus infection. Epidemiol Infect. 2020;148:e272.
Topaz G, Kitay-Cohen Y, Peled L, Gharra W, Kaminer K, Eitan M, et al. The association between red cell distribution width and poor outcomes in hospitalized patients with influenza. J Crit Care. 2017;41:166-9.
Supplementary Materials
Supplementary Tables 1, 2
Download