
Abstract
Clinical prediction models are often evaluated primarily by discrimination, although many clinical applications depend on the accuracy of absolute risk estimates. Calibration describes agreement between predicted probabilities and observed event frequencies and must be assessed separately from discrimination. This narrative methodological review focuses on models that predict binary outcomes and examines how calibration should be assessed, interpreted, reported, and updated. The calibration hierarchy and the use of flexible calibration curves are described together with calibration-in-the-large, calibration slope, the integrated calibration index, E-statistics, and the Brier score. The review explains why grouped goodness-of-fit procedures, including the Hosmer-Lemeshow test, cannot confirm adequate calibration and why performance estimates require measures of uncertainty and a validation sample sized for the desired precision. Calibration of regression and machine learning models is considered without assuming that any model class is inherently well calibrated. Methods for intercept-only updating, logistic recalibration, and non-linear post-hoc calibration are presented, with attention to evaluating updated models in data not used for the updating step. Worked examples show how the direction, magnitude, and location of miscalibration affect interpretation. Because calibration alone does not establish clinical usefulness, models intended to guide treatment should also be evaluated for clinical utility at relevant decision thresholds. A reporting checklist specifies the information needed to judge whether risk estimates are suitable for the intended population and clinical context.
Keywords: Calibration, clinical prediction model, binary outcome, model validation, recalibration, clinical utility
Introduction
A clinical prediction model can rank patients correctly while producing inaccurate probabilities. An area under the receiver operating characteristic curve of 0.90 indicates strong discrimination, but it does not demonstrate that an estimated risk of 30% is numerically accurate. If only 12% of patients with predictions near 30% experience the outcome, the model overpredicts the risk in that part of the risk distribution. This error may change treatment recommendations when decisions are linked to risk thresholds. Discrimination and calibration therefore describe different properties of a prediction model ().
Nevertheless, calibration is mentioned significantly less frequently than discrimination and is often misunderstood (). Current resources explain the methods for assessing calibration and constructing calibration models (), while reporting frameworks outline the necessary elements to report: the TRIPOD+AI statement now includes guidelines for reporting both regression and machine-learning prediction models (). This guide is intentionally designed to supplement, rather than replicate, that guidance. While TRIPOD+AI addresses “what should be reported?” this article focuses on “how should the reported calibration be interpreted, and what actions should be taken?” It is structured as a workflow encompassing calibration, interpretation, reporting, and recalibration and is intended for repeated use when documenting or evaluating a prediction-model study.
Scope and Review Approach
This article is a narrative methodological review of calibration methods for models that estimate the probability of a binary outcome. We considered methodological studies, reporting guidance, and applied tutorials addressing calibration assessment, validation, and model updating. Relevant sources were identified through PubMed and Google Scholar searches and by hand-searching the reference lists of key methodological papers and reporting guidelines. The article is intended to explain the interpretation and reporting of established methods. It is not a systematic review, and no formal assessment of risk of bias or certainty of evidence was undertaken. Calibration of time-to-event, competing-risk, ordinal, and multiclass predictions requires additional methods and is outside the present scope.
Discrimination and Calibration: Why AUC is not Enough
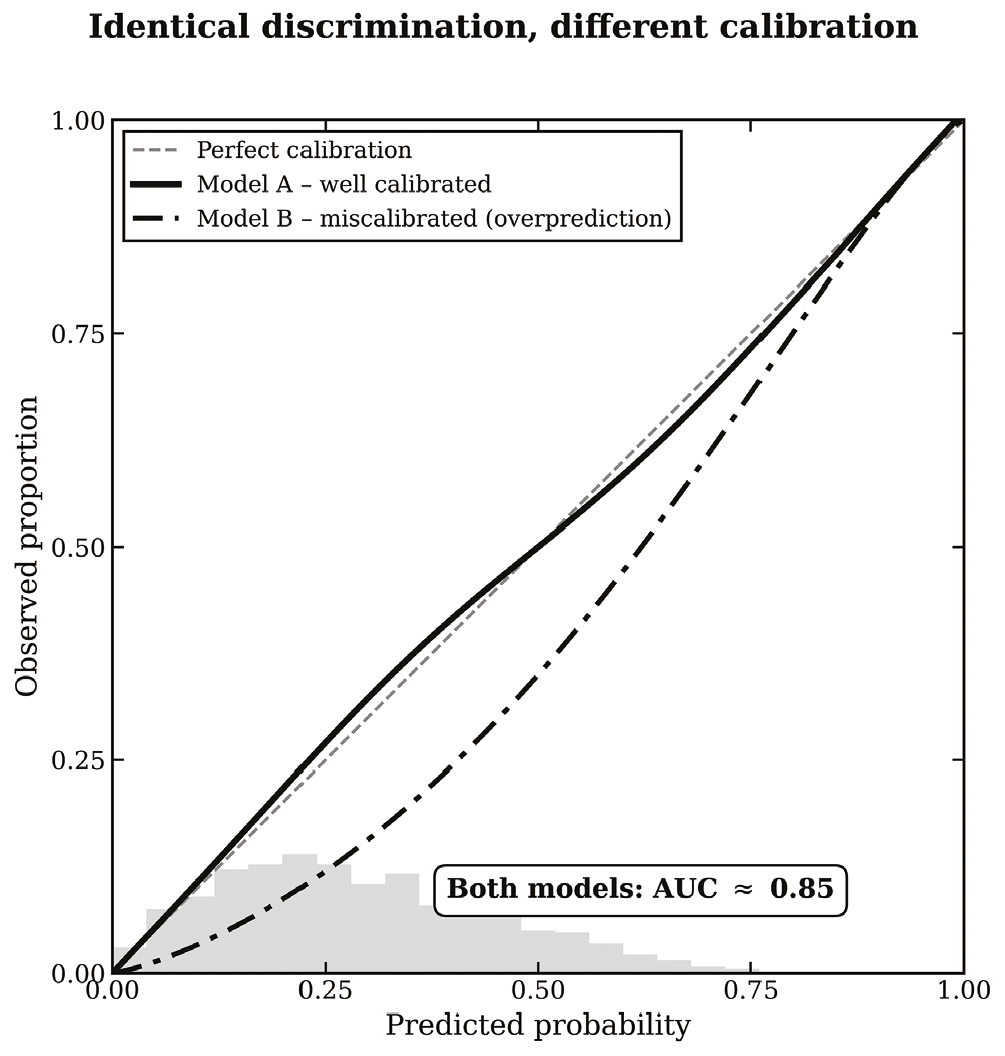
Discrimination and calibration are distinct concepts and largely independent (). Discrimination refers to a relative characteristic that relies solely on the ordering of predictions: the area under the curve (AUC) remains constant despite any transformation that maintains the order. Thus, even if every predicted risk is halved, the AUC stays the same, although calibration is compromised. Calibration, on the other hand, is an absolute characteristic based on precisely predicted values. Consequently, a high AUC does not guarantee that the predicted risks are numerically accurate (). illustrates this: two models with an identical AUC of 0.85 can exhibit markedly different calibration levels-one may align closely with the observed risk, while the other may consistently overestimate it. Only the accurately calibrated model can be relied upon to generate risk estimates suitable for decision-making.
Table 1. Discrimination and calibration answer different questions
Aspect | Discrimination | Calibration |
|---|---|---|
Question | Does the model rank patients with and without the event correctly? | Do the predicted probabilities match the observed frequencies? |
Nature | Relative-depends only on ranking | Absolute-depends on the exact predicted values |
Typical metric | C-statistic/AUC | Calibration plot, slope, intercept, ICI |
Behavior | Unchanged by monotone rescaling of predictions | Can be altered by rescaling of predicted probabilities. |
Blind spot | Says nothing about whether risks are numerically right | — |
Practical limitation | — | More fragile on transport; needs an adequate sample |
AUC: Area under the curve, ICI: Integrated calibration index
AUC: Area under the curve
The Calibration Hierarchy
Calibration can be evaluated with varying degrees of rigor (). Mean calibration, also known as calibration-in-the-large, requires that the average predicted risk aligns with the observed event rate. Weak calibration ensures that predictions are not consistently overestimated or underestimated (intercept 0) and are not excessively extreme or overly moderate (slope 1). Moderate calibration necessitates that predicted risks correspond to observed frequencies throughout the entire range, as indicated by a calibration curve that closely follows the diagonal. Strong calibration, which requires accurate probabilities for every covariate pattern, is practically impossible to achieve. In practical terms, moderate calibration is a suitable goal during validation and should be assessed using a flexible calibration curve in addition to metrics of weak calibration.
Reading a Calibration Plot
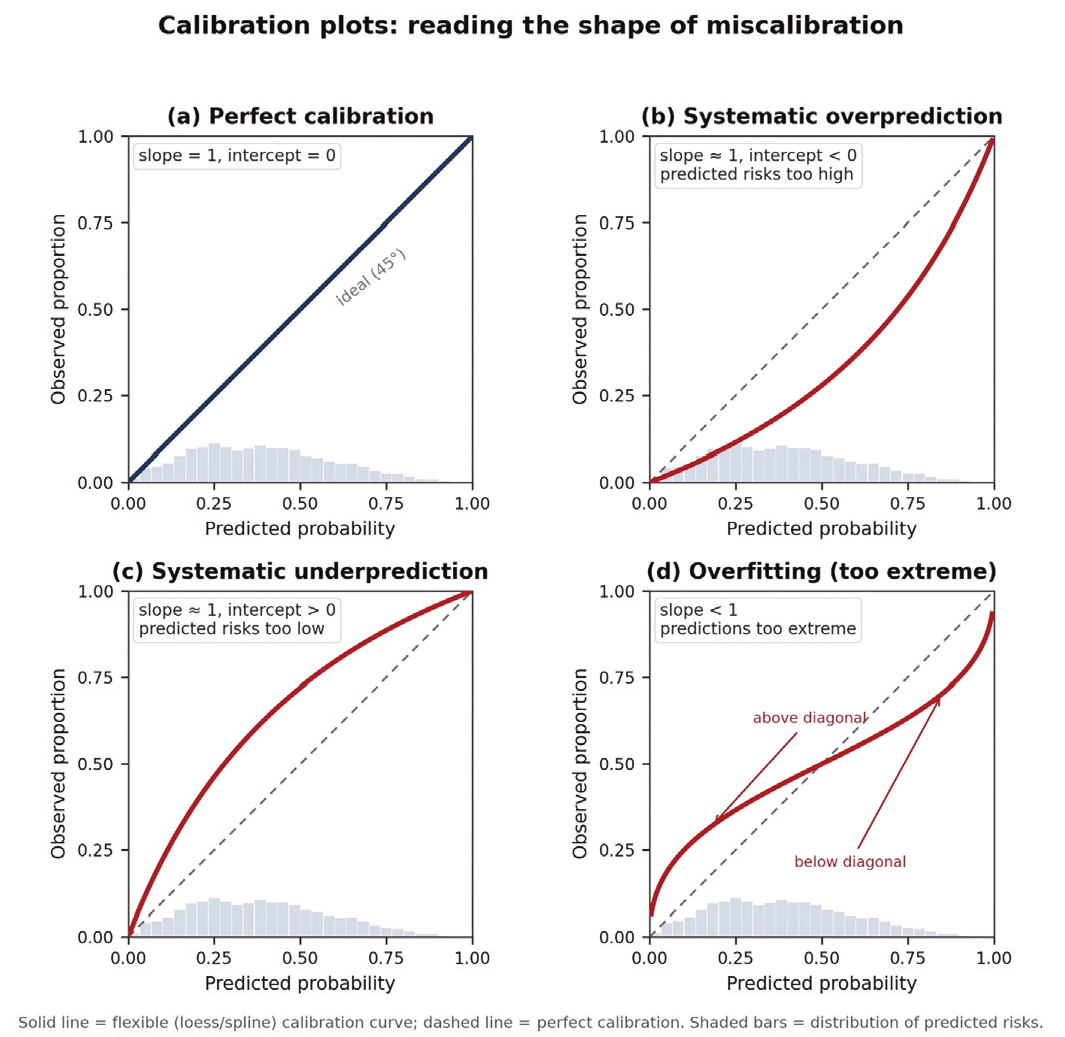
The primary instrument is the calibration plot, as depicted in . The horizontal axis represents predicted probability, while the vertical axis shows observed frequency, with a 45° line indicating perfect calibration. Instead of categorizing patients into deciles, which can be noisy and dependent on cut-points (), observed frequency should be estimated using a flexible smoother like loess or splines. Additionally, it’s important to display the distribution of predicted risks alongside, as the curve is least reliable in areas with sparse predictions (). The shape of the curve provides direct insight: if it falls below the diagonal, it indicates overprediction (); if it rises above the diagonal, it indicates underprediction (). A curve that is flatter than the diagonal, intersects it, and overestimates high risks while underestimating low risks signals overfitting; this is characterized by a calibration slope less than 1 ().
Numerical Calibration Metrics: How to Interpret Them
In addition to the calibration plot, several numerical measures were used to assess model calibration (). The calibration intercept, also referred to as calibration-in-the-large, measures the systematic difference between predicted and observed risks; its ideal value is 0. It was estimated using a logistic regression model with the linear predictor included as an offset, thereby fixing the calibration slope at 1. With this approach, a positive intercept indicates that the model tends to underestimate risk, whereas a negative intercept indicates overestimation. This differs from the intercept obtained when the calibration intercept and slope are estimated simultaneously in a logistic recalibration model [logit(p) = a + b·LP], because the intercept depends on the estimated slope and cannot be interpreted in the same way.
Table 2. How to interpret common calibration metrics
Metric | Ideal | What does it tell you? | If abnormal |
|---|---|---|---|
Calibration intercept | 0 | Overall systematic error (calibration-in-the-large) | >0 → underprediction (risks too low); <0 → overprediction (risks too high) |
Calibration slope | 1 | Whether predictions are too extreme or too moderate | <1 → predictions too extreme (overfitting); >1 → too moderate |
ICI | 0 | Mean absolute calibration error (probability scale) | Higher = worse; read as average percentage-point discrepancy |
E50 | 0 | Median absolute calibration error | Higher = worse |
E90 | 0 | 90th-percentile calibration error | Higher = worse; flags a poorly calibrated tail |
Emax | 0 | Maximum calibration error | Higher = worse; worst-case discrepancy |
Brier score | 0 | Overall probabilistic accuracy (discrimination + calibration) | Lower = better; not calibration-specific |
ICI: Integrated calibration index, E50/E90/Emax: median, 90th-percentile and maximum absolute calibration error
The calibration slope reflects how closely the predicted risks correspond to the observed outcomes, with an ideal value of 1. It is estimated as the coefficient of the linear predictor in the joint recalibration model. A slope below 1 suggests that predictions are too extreme, often as a result of overfitting, whereas a slope above 1 indicates that predictions are less extreme than they should be ().
The integrated calibration index (ICI) and E-statistics (E50, E90, and Emax) were used to quantify the differences between the calibration curve and the ideal diagonal line. These measures represent, respectively, the mean, median, 90th percentile, and maximum of the absolute differences. The ICI is particularly useful for interpreting the magnitude of calibration error: for example, an ICI of 0.05 indicates an average difference of approximately five percentage points between predicted and observed risks ().
The Brier score is a measure of overall prediction accuracy. It accounts for both discrimination and calibration and should therefore not be interpreted as a calibration measure alone (). summarizes the definitions and interpretations of these metrics, while the numerical values in the worked examples are illustrative.
The numerical values of calibration measures depend on the population in which they are estimated. The unscaled Brier score is influenced by outcome frequency, which limits comparisons across datasets with different event rates. Reporting the Brier score of a null model or the scaled Brier score can help quantify improvement over predictions based solely on the observed event rate. The ICI is weighted by the empirical distribution of predicted risks. A low ICI may therefore coexist with clinically relevant miscalibration in a narrow or sparsely represented part of the risk range. Emax should be interpreted cautiously because a small number of observations can determine its value.
It is important to exercise caution with thresholds: these metrics lack universal clinical cut-offs. Assigning a fixed value to determine whether an ICI, slope, or intercept is “good” or “bad” is risky, as the key factor is the extent of miscalibration in relation to the specific clinical decision being made. Metrics should be evaluated based on their inherent probability scale and the implications of overestimating or underestimating risk, rather than by comparing them to an arbitrary universal threshold ().
Calibration is not a Single Number
Calibration cannot be encapsulated by a single statistic or hypothesis test. A model might achieve a satisfactory Brier score but still be inadequately calibrated, as the Brier score also acknowledges discrimination (). A solitary summary, like the ICI, can obscure whether miscalibration is consistent or concentrated in a clinically significant segment of the risk spectrum. Thus, a comprehensive evaluation should include a minimum calibration set: (i) a flexible calibration plot showing the distribution of predicted risks, (ii) the calibration intercept, (iii) the calibration slope, (iv) an absolute measure such as the ICI or an E-statistic, and (v) the context in which these were validated (). When considered together, these elements reveal both the direction and location of any miscalibration; however, when viewed separately, each can be misleading.
Uncertainty and Sample Size
Calibration statistics are sample estimates and should be reported with measures of precision. Confidence intervals should accompany the calibration intercept and slope. A flexible calibration curve should include pointwise confidence bands when these can be estimated reliably. The ICI and E-statistics are also subject to sampling uncertainty. Emax is particularly sensitive to sparse observations at the extremes of the predicted-risk distribution. Bootstrap methods can be used to obtain confidence intervals for these quantities.
The sample size for external validation should be determined by the precision required for the performance measures of interest. A minimum number of participants or outcome events alone does not ensure a reliable calibration analysis. The required sample size depends on outcome frequency, the distribution of predicted risks, anticipated model performance, and the desired precision of the calibration intercept, slope, and observed-to-expected ratio ().
Calibration and Clinical Utility
Calibration is necessary when predicted risks are used to guide treatment, but calibration alone does not establish clinical usefulness. At a given threshold probability, models with similar calibration may identify different numbers of true-positive and false-positive cases. Model selection for clinical use should therefore include an explicit assessment of the consequences of threshold-based decisions. Decision curve analysis expresses these consequences as net benefit and allows comparison with default strategies such as treating all patients or treating none (, ).
Discrimination, calibration, and clinical utility answer different questions. A model may have acceptable calibration and still provide no clinical benefit at the intended threshold. Conversely, the effect of miscalibration on clinical decisions may vary across the range of threshold probabilities. Claims about treatment selection should be supported by an analysis performed at clinically relevant thresholds.
Why a Non-significant Hosmer-Lemeshow Test does not Mean Good Calibration
The Hosmer-Lemeshow test remains a common method for “confirming” calibration, with a p-value exceeding 0.05 frequently interpreted as proof of a model’s good calibration. However, this interpretation is incorrect. The test divides patients into bins, typically by deciles, and compares the observed counts with the expected ones. It has three significant flaws: the grouping is arbitrary; its power is highly dependent on sample size, making it underpowered in small samples and almost always significant in very large ones; and it only provides a p-value without indicating direction, magnitude, or where miscalibration occurs along the risk spectrum (). Consequently, a non-significant result with a moderate sample size can still be consistent with clinically significant miscalibration. Therefore, this test should not be the primary or sole method for assessing calibration; the minimum calibration set mentioned earlier is much more informative ().
Calibration Across Validation Settings
Calibration should be interpreted based on the method of assessment (). Calibration that appears accurate on development data tends to be overly optimistic; internal validation methods, such as bootstrapping or cross-validation, adjust for this optimism and often show a calibration slope less than 1. The most revealing test is external validation, conducted in a different time frame or context, where models frequently fail due to variations in case-mix and outcome prevalence affecting calibration more than discrimination (). Since performance is tied to the specific population and timing of assessment, no model is permanently “validated” ().
Table 3. Validation settings and what each says about calibration
Setting | What is it telling us? | Main limitation |
|---|---|---|
Apparent (development data) | In-sample fit; upper bound on performance | Optimistic; ignores overfitting |
Bootstrap | Internal optimism correction | Same source population |
Cross-validation | Internal validation | May not capture transportability |
Temporal validation | Performance over time; drift | Setting-specific |
Geographic/external validation | Transportability to new settings | Requires an external cohort |
Calibration in Machine Learning Models: What Changes?
Calibration behavior cannot be inferred from the name of an algorithm alone. It depends on the loss function, regularization, hyperparameter tuning, class sampling, sample size, and the population in which the model is evaluated. Logistic regression fitted by maximum likelihood has, in its development data under standard conditions, an apparent calibration intercept of 0 and a slope of 1. This property does not guarantee that the flexible calibration curve follows the diagonal, nor does it extend to new populations. Penalization, class weighting, and sampling procedures may also alter apparent calibration.
Machine learning models may produce predictions that are too extreme, too moderate, or poorly calibrated otherwise. These patterns should be assessed using validation data rather than assumed based on the type of model (). A large systematic review found no consistent advantage of machine learning over logistic regression for clinical prediction models using structured data (). However, findings vary across studies. Depending on the clinical setting, sample size, outcome, and modeling approach, machine learning models may perform similarly to or better than logistic regression ().
Table 4. Calibration behavior of common model classes and the strategy usually used to obtain calibrated probabilities
Model | Output probabilities | Common concern in validation | Typical strategy |
|---|---|---|---|
Logistic regression | Yes | Optimism in development data; non-linear miscalibration; changes in baseline risk or predictor effects during transport. | Validate calibration in the intended setting; update the intercept or slope only when indicated |
Random forest | Yes (vote proportions) | Model-dependent miscalibration; compressed or irregular probability estimates may occur. | Platt scaling or isotonic regression |
Gradient boosting | Yes | Model-dependent overconfidence or underconfidence. | Platt scaling or isotonic regression |
Support vector machine | No (decision scores) | Decision scores are not probabilities and require a separate probability mapping. | Platt scaling to obtain probabilities |
Neural network | Yes (sigmoid/softmax) | Overconfidence may occur, particularly after extensive fitting. | Temperature scaling, Platt scaling, or isotonic regression |
Recalibration should be considered when validation reveals miscalibration large enough to affect the model’s intended clinical use. Platt scaling uses logistic regression to adjust the original prediction scores, whereas isotonic regression allows a more flexible, non-linear adjustment but generally requires a larger calibration sample. Regardless of the method, calibration must be performed without using the outcomes from the final evaluation dataset. When the sample size is too small to establish separate training, calibration, and evaluation datasets, nested resampling provides an alternative for assessing model performance while accounting for the calibration process (-).
Model Recalibration
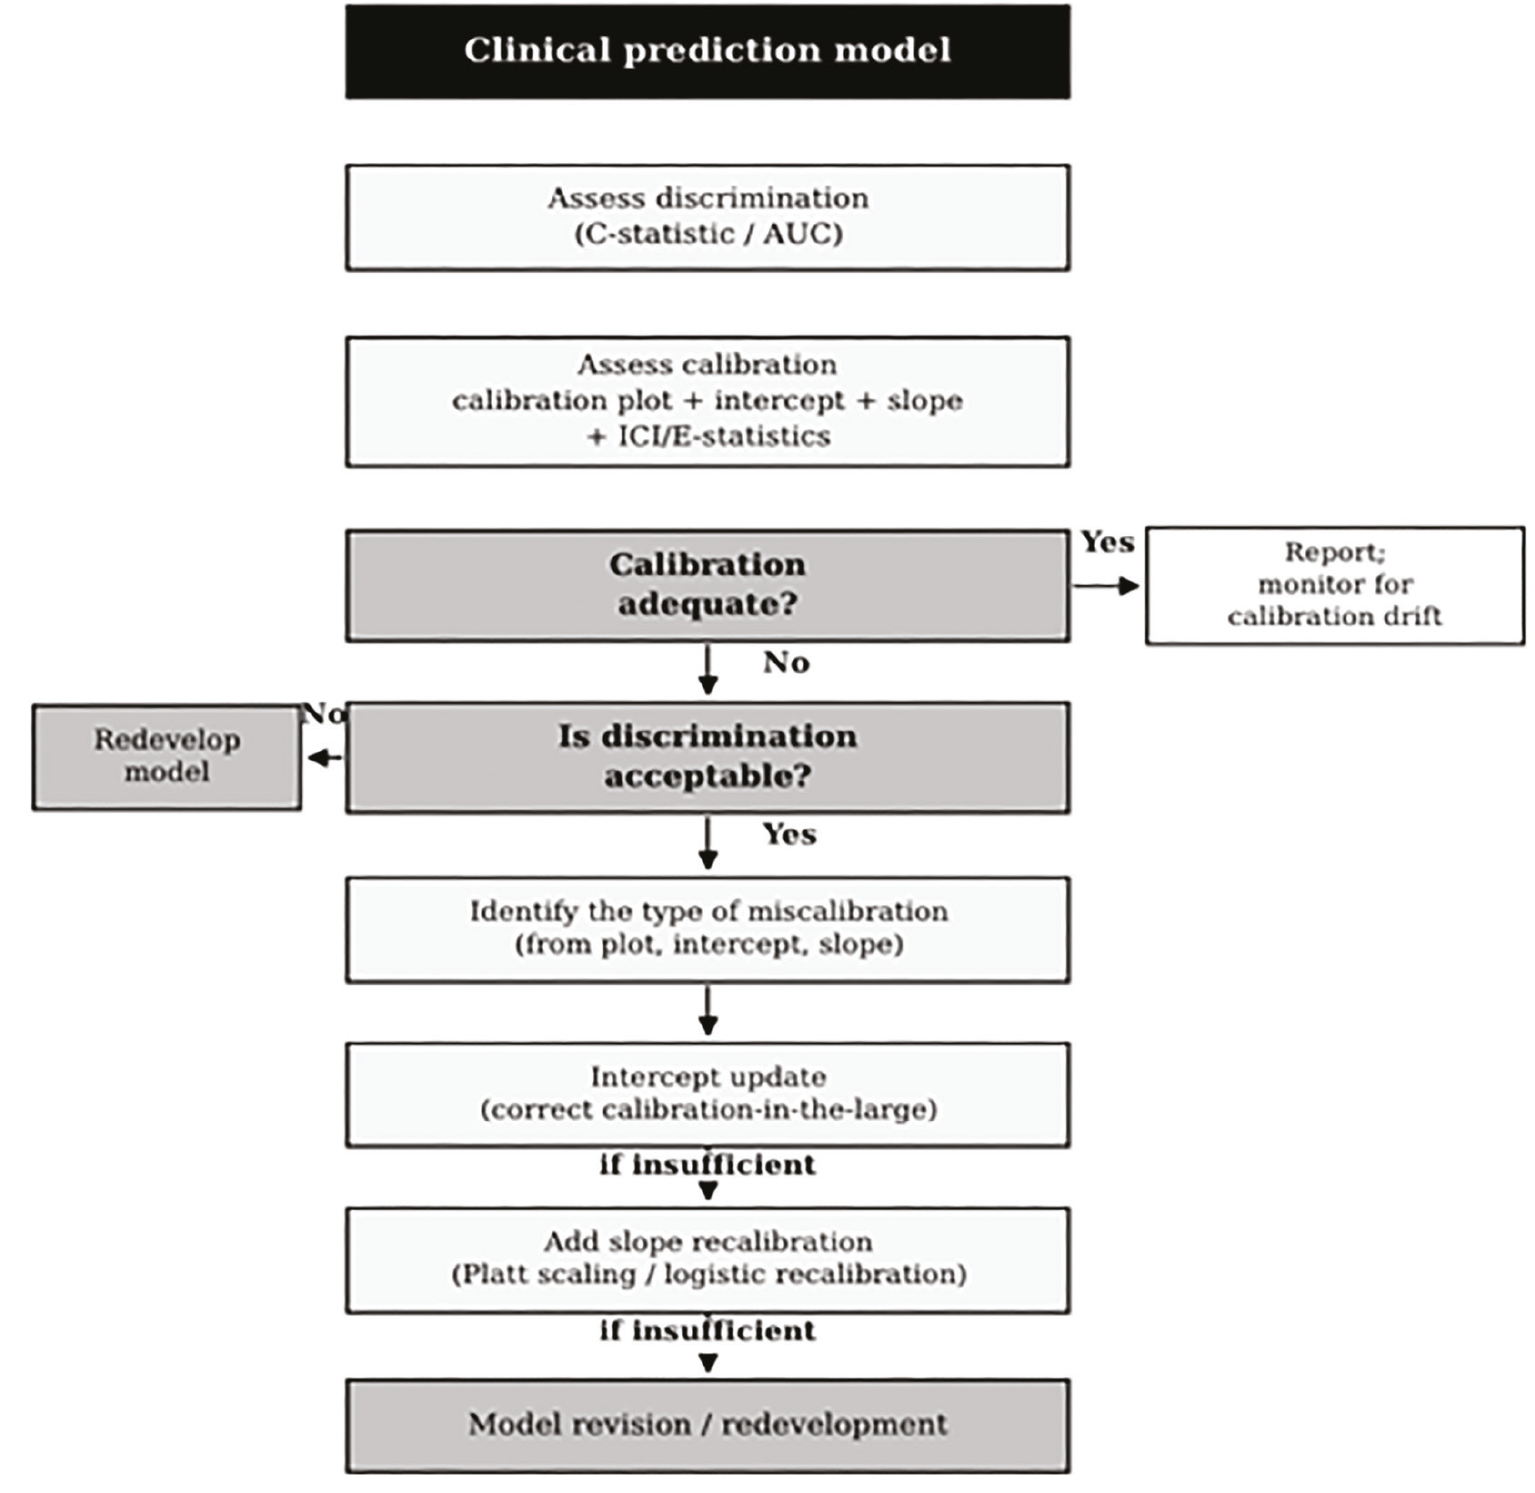
A stepwise workflow for assessing and managing calibration, from the initial assessment of discrimination and calibration to intercept updating, slope recalibration, and model revision, is summarized in . Let p denote the probability produced by the original model. Intercept-only updating estimates a new intercept while fixing the coefficient of the original linear predictor at 1:
AUC: Area under the curve, ICI: Integrated calibration index
logit(p*) = a + logit(p).
This update corrects calibration-in-the-large while preserving the relative spread of the original predictions. A negative value of a is expected when the original model systematically overpredicts risk.
Logistic recalibration estimates both an intercept and a slope:
logit(p*) = a + b logit(p).
A value of b below 1 shrinks predictions that are too extreme. A value above 1 increases the spread of predictions that are overly moderate. This model can correct weak calibration, but cannot remove non-linear deviations of the flexible calibration curve from the diagonal. More flexible methods, including isotonic regression, may address non-linear miscalibration but can overfit small calibration datasets.
Recalibration should be treated as a model-updating procedure. The performance reported in the data used to estimate a and b is optimistic. The updated model should be evaluated on new data or by a resampling procedure that repeats the entire updating process. The final report should provide the updated equation, the source and size of the recalibration sample, and calibration and clinical-utility results after updating (, ).
Worked Examples
The following examples illustrate how the metrics are interpreted together. Values are illustrative.
Example 1) Strong Discrimination, Inadequate Calibration: A model presents an AUC of 0.91, a calibration intercept of -0.42, a slope of 0.63, and an ICI of 0.071. Although discrimination is strong, the negative intercept indicates an overall overprediction, and the estimated slope of 0.63 suggests that the predictions are too extreme. The ICI indicates that predicted and actual risks differ, on average, by approximately seven percentage points. Even with the high AUC, these absolute risks should not be used for decision-making without recalibration.
Example 2) Moderate Discrimination, Good Calibration: A model indicates an AUC of 0.78, an intercept of 0.03, a slope of 0.97, and an ICI of 0.021. Although discrimination is only moderate, the intercept is close to 0, the slope is near 1, and the average calibration error is roughly two percentage points, which together demonstrate that the predicted probabilities are closely aligned with the observed risk. These estimates are consistent with moderate discrimination and mild miscalibration in this sample. They do not establish that the model should be used to determine treatment at a 10% threshold. That decision requires comparing net benefit at 10% and considering the relative consequences of false-positive and false-negative classifications. Neither AUC nor calibration metrics provide this information on their own.
Example 3) External Validation: During the development phase, a model achieves an AUC of 0.88 with a slope of 1.00 and an intercept of 0.00. However, in external validation, the AUC decreases to 0.84, with a slope of 0.71, an intercept of -0.31, and an ICI of 0.058. While discrimination remains largely preserved, calibration has worsened: the slope has dropped to 0.71, indicating that predictions are too extreme in the new context; the negative intercept suggests overprediction. The negative intercept is consistent with a lower event rate in the validation setting, but the performance estimates do not identify the cause of miscalibration. Differences in case mix, predictor measurement, clinical practice, outcome definition, or predictor effects should also be considered. This pattern is common in transport scenarios, where calibration issues arise before discrimination problems, necessitating recalibration (updating the intercept and likely adjusting the slope) before applying the model locally. Published examples of calibration findings in clinical prediction models are summarized in .
Table 5. Examples of calibration in clinical prediction models
Clinical prediction model | Outcome and validation setting | Reported performance | Calibration finding | Practical interpretation |
|---|---|---|---|---|
QRISK3 | Ten-year cardiovascular disease risk; independent external validation in 403,370 UK Biobank participants | Harrell C-statistic 0.722 in women and 0.697 in men | Systematic overprediction, particularly in older participants, by as much as 20% | Moderate discrimination did not ensure accurate absolute risk; recalibration or an alternative model may be needed for UK Biobank applications (20). |
Spanish MBDS ischemic-stroke mortality model | In-hospital mortality after ischemic stroke; temporal external validation in a 2016-2018 Spanish national cohort | AUC 0.726 on external validation and 0.743 after coefficient refitting | All model coefficients were re-estimated in the later cohort, modestly improving discrimination; this was model refitting rather than simple intercept or slope recalibration | The study illustrates temporal model drift and coefficient refitting before reuse in a later population; comprehensive calibration measures were not reported (21). |
Cardiovascular clinical prediction models, pooled literature | Multiple cardiovascular outcomes; 2,030 external validations of 1,382 models | Median external-validation AUC 0.73; 81% of validations reporting AUC showed lower discrimination than in development data | Only 53% of validations reported any calibration measure, and performance varied substantially across settings | External validation commonly reveals performance loss, while incomplete calibration reporting limits assessment of whether absolute risks are clinically usable (22). |
ISARIC 4C Deterioration model | In-hospital clinical deterioration among adults hospitalized with COVID-19; held-out validation in 8,239 patients from London | C-statistic 0.77 (95% CI 0.76-0.78) | Calibration-in-the-large 0.00 (95% CI -0.05 to 0.05) and calibration slope 0.96 (95% CI 0.91-1.01) | Moderate discrimination was accompanied by near-ideal weak calibration in the held-out region, illustrating that calibration and discrimination should be reported jointly (23). |
EuroSCORE II | Thirty-day mortality after cardiac surgery for infective endocarditis; nationwide Netherlands registry, 2,569 patients | AUC 0.72; O: E ratio 0.69 | Overall mortality was overpredicted, with overprediction concentrated above a 20% predicted probability | Acceptable ranking can coexist with risk-range-specific miscalibration; high predicted risks require caution, and performance was poor in emergency surgery (24). |
PREDICT Breast v3.1 | Ten-year overall survival after early breast cancer; external validation in national cohorts from the Netherlands and Sweden | AUC 0.75 in both national cohorts | Calibration was near ideal overall in Sweden and showed slight underestimation of mortality in the Netherlands; slopes were lower in patients aged ≤40 years | Good average calibration at the population level can mask clinically relevant subgroup miscalibration, supporting subgroup-specific assessment (25). |
Findings are derived from different validation studies and are not directly comparable across models, outcomes, populations, or study settings.
AUC: Area under the curve, CI: Confidence interval, ISARIC: International severe acute respiratory and emerging infections consortium, MBDS: Minimum basic data set, O:E ratio: Observed-to-expected events ratio.
A Ten-point Calibration Reporting Checklist
• Is the predicted outcome and, where relevant, the prediction horizon defined?
• Is the population, setting, and type of validation stated?
• Is a flexible calibration curve presented together with the distribution of predicted risks?
• Are confidence intervals or confidence bands reported for the main calibration estimates?
• Are calibration-in-the-large and the calibration slope reported with their estimation methods?
• Is an absolute calibration measure reported and interpreted on the probability scale?
• Is the sample size justified according to the precision required for calibration assessment?
• Is calibration examined over the clinically relevant risk range and in important subgroups when supported by the sample size?
• Is clinical utility evaluated at prespecified decision thresholds when the model was intended to guide an intervention?
• If the model is updated, are the updating equation, data used for updating, and subsequent performance reported?
Conclusion
Calibration describes whether predicted probabilities agree with observed risks in a defined population and time period. It should be assessed with a flexible calibration curve, calibration-in-the-large, a calibration slope, and measures of uncertainty. The ICI, E-statistics, and Brier score provide supplementary information, but their interpretation depends on sample size, outcome frequency, and the distribution of predicted risks.
Miscalibration may be corrected by intercept updating or logistic recalibration when the original model retains useful predictive information. Any updated model requires further evaluation. When predictions are intended to guide treatment, calibration results should be considered together with clinical utility at the relevant decision thresholds. Performance should be reassessed after being transported to another setting and when changes in outcome incidence, predictor measurements, or clinical practice are suspected.
Footnotes
Author Contributions
Concept: H.A., B.T., L.S., A.E.-M., B.C., Design: H.A., B.T., L.S., A.E.-M., B.C., Literature Search: H.A., B.T., L.S., A.E.-M., B.C., Writing: H.A., B.T., L.S., A.E.-M., B.C.
Conflict of Interest: Bahadır Taşlıdere, Lukasz Szarpak, and Başar Cander are members of the Editorial Board of the Eurasian Journal of Emergency Medicine. However, they were not involved in any stage of the editorial decision process for this manuscript. The editors who evaluated this manuscript are from different institutions. The other authors declared no conflict of interest.
Financial Disclosure: The authors declared that this study received no financial support.
References
Van Calster B, McLernon DJ, van Smeden M, Wynants L, Steyerberg EW; Topic Group ‘Evaluating diagnostic tests and prediction models’ of the STRATOS initiative. Calibration: the Achilles heel of predictive analytics. BMC Med. 2019;17:230.
Alba AC, Agoritsas T, Walsh M, Hanna S, Iorio A, Devereaux PJ, et al. Discrimination and calibration of clinical prediction models: users’ guides to the medical literature. JAMA. 2017;318:1377-84.
Huang Y, Li W, Macheret F, Gabriel RA, Ohno-Machado L. A tutorial on calibration measurements and calibration models for clinical prediction models. J Am Med Inform Assoc. 2020;27:621-33.
Collins GS, Moons KGM, Dhiman P, Riley RD, Beam AL, Van Calster B, et al. TRIPOD+AI statement: updated guidance for reporting clinical prediction models that use regression or machine learning methods. BMJ. 2024;385:e078378.
Van Calster B, Nieboer D, Vergouwe Y, De Cock B, Pencina MJ, Steyerberg EW. A calibration hierarchy for risk models was defined: from utopia to empirical data. J Clin Epidemiol. 2016;74:167-76.
Van Hoorde K, Van Huffel S, Timmerman D, Bourne T, Van Calster B. A spline-based tool to assess and visualize the calibration of multiclass risk predictions. J Biomed Inform. 2015;54:283-93.
Austin PC, Steyerberg EW. The integrated calibration index (ICI) and related metrics for quantifying the calibration of logistic regression models. Stat Med. 2019;38:4051-65.
Steyerberg EW, Vickers AJ, Cook NR, Gerds T, Gonen M, Obuchowski N, et al. Assessing the performance of prediction models: a framework for traditional and novel measures. Epidemiology. 2010;21:128-38.
Riley RD, Snell KIE, Archer L, Ensor J, Debray TPA, van Calster B, et al. Evaluation of clinical prediction models (part 3): calculating the sample size required for an external validation study. BMJ. 2024;384:e074821.
Van Calster B, Vickers AJ. Calibration of risk prediction models: impact on decision-analytic performance. Med Decis Making. 2015;35:162-9.
Vickers AJ, Elkin EB. Decision curve analysis: a novel method for evaluating prediction models. Med Decis Making. 2006;26:565-74.
Kramer AA, Zimmerman JE. Assessing the calibration of mortality benchmarks in critical care: The Hosmer-Lemeshow test revisited. Crit Care Med. 2007;35:2052-6.
Van Calster B, Steyerberg EW, Wynants L, van Smeden M. There is no such thing as a validated prediction model. BMC Med. 2023;21:70.
Christodoulou E, Ma J, Collins GS, Steyerberg EW, Verbakel JY, Van Calster B. A systematic review shows no performance benefit of machine learning over logistic regression for clinical prediction models. J Clin Epidemiol. 2019;110:12-22.
İkiz F, Ak A. Machine learning vs. conventional statistics in predicting medical outcomes: a comparative performance analysis using a viral disease dataset. Eurasian J Emerg Med. 2026;25:228-36.
Guo C, Pleiss G, Sun Y, Weinberger KQ. On calibration of modern neural networks. In: proceedings of the 34th International Conference on Machine Learning (ICML). PMLR. 2017;70:1321-30.
Niculescu-Mizil A, Caruana R. Predicting good probabilities with supervised learning. In: Proceedings of the 22nd International Conference on Machine Learning (ICML). 2005:625-32.
Jiang X, Osl M, Kim J, Ohno-Machado L. Calibrating predictive model estimates to support personalized medicine. J Am Med Inform Assoc. 2012;19:263-74.
Steyerberg EW. Clinical prediction models: a practical approach to development, validation, and updating. 2nd ed. Cham: Springer; 2019.
Parsons RE, Liu X, Collister JA, Clifton DA, Cairns BJ, Clifton L. Independent external validation of the QRISK3 cardiovascular disease risk prediction model using UK Biobank. Heart. 2023;109:1690-7.
García-Torrecillas JM, Lea-Pereira MC, Amaya-Pascasio L, Rosa-Garrido C, Quesada-López M, Reche-Lorite F, et al. External validation and recalibration of a mortality prediction model for patients with ischaemic stroke. J Clin Med. 2023;12:7168.
Wessler BS, Nelson J, Park JG, McGinnes H, Gulati G, Brazil R, et al. External validations of cardiovascular clinical prediction models: a large-scale review of the literature. Circ Cardiovasc Qual Outcomes. 2021;14:e007858.
Gupta RK, Harrison EM, Ho A, Docherty AB, Knight SR, van Smeden M, et al. Development and validation of the ISARIC 4C deterioration model for adults hospitalised with COVID-19: a prospective cohort study. Lancet Respir Med. 2021;9:349-59.
Heinen FJ, Peijster AJL, Fu EL, Kamp O, Chamuleau SAJ, Post MC, et al. External validation of EuroSCORE I and II in patients with infective endocarditis: results from a nationwide prospective registry. Eur J Cardiothorac Surg. 2024;66:ezae418.
Verheul EM, Doornkamp F, Petrov I, Siesling S, Lingsma HF, Koppert LB, et al. External validation of PREDICT Breast v3.1 for overall survival in international cohorts, including young and invasive lobular subgroups. Breast Cancer Res Treat. 2026;217:14.